Posted On: Friday - March 28th 2025 8:11PM MST
In Topics: Music Global Climate Stupidity Geography Science
OMG! Remember that last graph in Part 1. Where are the Polar Bears? You've killed
Where'd we leave off. Oh, yeah,I noted something about the vertical axes of the graphs that the somewhat alarmist (but not too bad) commenter in our conversation linked me to (also for Greenland and the sea ice stuff). This was a decrease from the horizontal axis representing 0 ice mass lost/gained.
OK, well, someone who was not quite so gullible to alarmism might well ask, hey, -2,700 Gt, out of, well, I wonder how big the whole ice sheet is.
The units on the vertical axis are Gt – Giga Metric Tonnes, i.e. 1 x 10^9 tonnes, with each tonne = ~2,200 lb. I will use English units till near the end, because I like 'em.
It should be easy enough to look up “mass of Antarctica ice sheet”. No, not really. I don’t chalk this up to conspiracy, but it’s just that the alarmist “ice loss” blurbs kept on going till I gave up. No worries, wiki up top give the volume as 6,400,000 cubic miles.
There are 5,280 ft/mile, so 5,2803 ft3/mi3 = ~ 1.5 x 1011 ft3/mi3. I will assume zero compresssibility of ice (for now) and the usual 58 lb/ft3 density (remember, it floats due it being slightly less dense than water). That’s 8 x 10¹² lb/mi3. We’ve (they’ve? “We’ve”, if Trump claims the place) got 6.4^106 mi3 of ice, so that’s 5.5 x 10¹⁹ lb = 2.5 x 10¹⁶ metric tonnes / 1 x 10⁹ tonnes/Gt to match the units, so ~ 25 million Gt. Note, that is already in GigaTonnes, so we can compare to that ghastly -2,700 Gt decrease on the graph, before they changed the methodology in ’18 (more about that too).
That lowest loss means 2,700/25,000,000 = a .011% decrease in ice mass. That’s 1 in 10,000! Now, I realize that if the entire ice sheet on Antarctica were to melt, well THAT would be a crisis! It’s an easy calculation I’ll do another time to see how much that would raise sea levels (spoiler alert from simple judgement – it’s be a REAL calamity).
Wait, let's go back and think about how they measure this ice mass, or at least changes in ice mass. This has been done using 2 different methods, each via satellites.
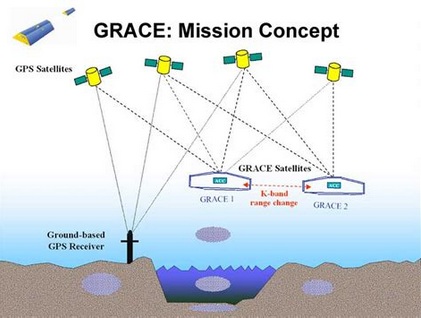
The GRACE satellites use the very minute effects of changes in mass below on the orbit of satellites. Note that the GPS satellites are used to ascertain a very accurate position of the GRACE satellite. The system is more clever than that though. The mission uses a pair of satellites in an almost polar orbit that fly 140 miles apart. The distance between the 2 is measured, so that changes in orbital velocity that reflect very slight gravitational differences through the orbit can be detected.
This system was used from '02* through Oct. '17. (I wonder if the end date was due to one of the satellites dying.) Note that this date matches the end of the first, bigger, portion of the data.
To determine changes in ice mass, we must compare differences in the gravitational field to the whole. Can they really determine not only 1 in 10,000, as that was just the total decrease, but 1 in ~200,000 - the data shows changes of at least as low as 1/20th of the whole drop. Yeah, well, I don't know enough to argue with NASA or the German Aerospace Center (partner), but when you read:
The highly precise accelerometer that is needed to separate atmospheric and solar radiation pressure effects from the gravitation data...... you know it's pretty complicated engineering.
Sometime in late '18 or so, they started using the JASON satellites for this research.
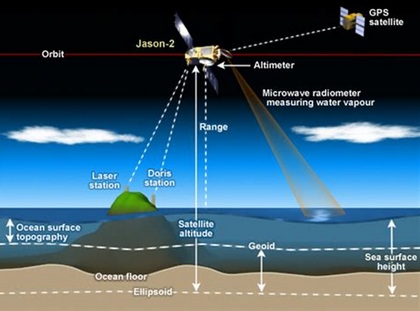
The JASON series of satellites uses radar altimetry to get significant wave heights, sea level averages, and for the latter part of these Antarctic ice mass measurements, ice cap height.
Radar altimetry has been around for a long time, but knowing the exact height of the satellites above the Earth's center of mass or fitted perfect sphere (whatever they do) still sounds pretty complicated. I'll not argue any of that either. If they can get "significant wave heights" or see sea level rises, we may be talking about inches here (for the latter). To determine changes in ice mass, they must compare differences to the total, hence radar-alt height to total thickness. Just using that average ice pack thickness of 1.4 miles - say 7,000 ft. - that 1 in 10,000 is nearly a foot. However, that 1 in 10,000 is the TOTAL change. I see in the graph changes of about 1/20 of that. Can they really measure half an inch?
I am not in a position to argue the purported (by yesterday's graph) 1 in 200,000 resolution of ice mass measurement. During my time looking into this stuff, I came upon something very fortuitously. When using that 58 lb/ft3 density of ice, I didn't see a reason to get into more detail as I didn't need the ice mass value very accurately +/- 25% would have been fine. However, I did think about compressibility of ice and whether that'd be a factor in that 2nd, JASON-based radar altimetry method. Lo and behold, the 2nd blurb I found was a link to Density matters: ice compressibility and glacier mass estimation from Cambridge University, a short paper ("communication" vs. real paper, in the British tech-journal lingo) from '22. Not only was I very lucky to ever get to that, but I found I COULD READ IT! (The whole thing.)
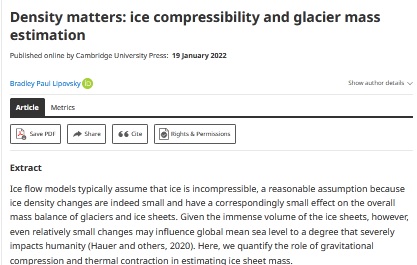
This short paper got right to my point:
Ice flow models typically assume that ice is incompressible, a reasonable assumption because ice density changes are indeed small and have a correspondingly small effect on the overall mass balance of glaciers and ice sheets. Given the immense volume of the ice sheets, however, even relatively small changes may influence global mean sea level to a degree that severely impacts humanity (Hauer and others, Reference Hauer2020). Here, we quantify the role of gravitational compression and thermal contraction in estimating ice sheet mass.My bolding there, as I want to show that there are 2 factors. I hadn't though about the thermal effects. The paper uses a linear T-profile, from 0 C right on top of the actual land down to mean annual surface temperature at the boundary with the air above. Quick conclusion, and note the honesty, mostly 2 significant digits of precision, in these values. (Oh, and they did Greenland too - let Trump worry about Greenland. He's got that.)
We calculate that gravitational compression deforms the surface of the Greenland and Antarctic ice sheets by up to 5.8 and 11.3 m, respectively. For thermal contraction, the corresponding values are 2.9 and 6.2 m, respectively. The corresponding ice sheet-averaged values are 0.5 and 0.7 m for thermal contraction and 0.8 and 0.7 m for gravitational compression.Even the lower of these numbers are larger than what the 1 in 10,000 even, much less 1 in 200,000 purported precision must be from radar altimetry. Using the whole-ice-sheet-averaged differences from these two effects we see that the top of the ice sheet could be up to 2.3 ft (0.7m) lower due to compression of the ice (change in its density) and the same amount additionally lower to thermal compression effects. (The 2nd of these guys' pairs of numbers are for Antarctica.) That's 4 1/2 ft total, which out of 7,000 ft average ice thickness, is over 6 in 10,000. This error is larger than the whole ice mass decrease reported!
Now, that bit of simple math is something I came upon out of sheer luck. These effects shouldn't effect the GRACE numbers, because that system relied on gravitational force, hence mass, directly. Then, note though, that after the gap in data, the JASON data, for which two means of compression override the purported precision, there is no drop in ice mass. I'm beginning to think that this graph is complete garbage.
If the Peak Stupidity reader has gotten this far, you deserve our congratulations. I really like this stuff, is all.
However, even if I hadn't come upon this significant source to show me how much in error the data could be, there's the very basic deal that I imagine most readers WOULD be onto already. I did not purposely make the units on the vertical axis hard to read, but that is all I am getting to. The numbers are in GigaTonnes. (Billions of metric tonnes.)
I kind of blew the suspense up top but, again, what is the denominator for that 2,700 GigaTonne drop? That's what I calculated very simply above - a number a www search could have probably spit out easily 10 years ago - 25 Million GigaTonnes. Let's look at a graph over these 25 years of total ice mass to see that big loss due to the Climate Calamity™:
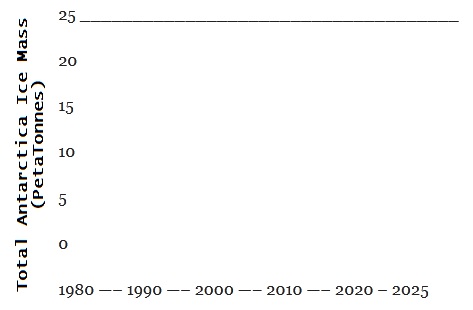
This is the SAME GRAPH as is on the last post.
Peak Stupidity confession here: It didn't take LOTUS 123 or even the latest version of whatever spreadsheet program is hip now to make that. I simply drew a horizontal line with underscores! What kind of lazy behavior is this? I'll tell you why there was no point in using a spreadsheet:
If this graph shows up as, say, 4″ high, on your screen, then the decrease of the line would be .0004″ = one hundredth of a millimeter. Let’s say, cause you’re a gamer or porn addict – not (some of) you, Peak Stupidity readers, but the general “you”, you’ve got a 100 pixels/in screen. The decrease in my line above is 1/25th of a pixel. Sorry, man, I can't show that, and you couldn't see it.
That's the answer to the question posed in the last post. This form of graphical alarmism (hey, I like that term!) is not the same as picking a data range (of years). This one involves showing changes alone without showing the base number. Yes, it's a big scam, and you ain't
So, in conclusion, Penguins and Polar Bears alike, chillax, dudes! Nothing's gonna change your world. Nothing's gonna change your world...
Kangaroo Days, ohhhh, Ohm...
Hey, listen, there wasn't always the internet to look up lyrics on. "Kangaroo Days" is the lyric, and that's final!
* Launched by Russian rockets, BTW.
Comments:
Moderator
Monday - March 31st 2025 6:07AM MST
PS: "GPS give very precise time, but position is a lot less precise than most people realize. The receivers in our gadgets might have a horizontal accuracy of 3m 95% to 98% of the time. High-end stuff might have a horizontal accuracy down to 2cm. Vertical accuracy might be roughly 1.7x the horizontal accuracy."
I remember back in the 1990s when the GPS signals were purposely degraded (they used another term) for civilian use. For flying a hundred feet or so is generally good for en-route. Then for approaches you need much better - I'd just guess a couple of feet, but there are the Local Area Augmentation Systems (there's WAAS too, but I think it's the former) to correct the signals based on their known position on the ground to get the accuracy way up.
Where does one get the "high-end stuff with that 1 in accuracy, BTW? I could use it for a few things. (Seems good for surveying.)
What you wrote at the end of that comment is what I was getting at in mentioning the GPS satellites. If you're purportedly measuring surfaces within an inch, then the GSP pos info must be more accurate than that.
The Alarmist
Sunday - March 30th 2025 8:43AM MST
PS
GPS are supposedly not affected as the atmospheric warming and expansion attributable to solar wind extends to about 1,000 km, while the satellite constellation is at 20,000km.
The JASON series orbit at circa 1,300 km to 1,400 km, so there is some risk of orbital decay as the atmosphere expands with changes in solar wind. Mind you, it also uses changes in microgravity, so it is also subject to conditions below the crust if those are not already taken into account in its algorithms.
GPS give very precise time, but position is a lot less precise than most people realize. The receivers in our gadgets might have a horizontal accuracy of 3m 95% to 98% of the time. High-end stuff might have a horizontal accuracy down to 2cm. Vertical accuracy might be roughly 1.7x the horizontal accuracy.
Let’s assume the GIS satellites use the best of the best. Any changes of measure less than 3.4cm might be “signal,” but might be “noise.” Half an inch is circa 1.27cm, so if that is the measured vertical change in the ice pack, then the measurement is not statistically significant by virtue of the error inherent in the GPS system alone, ignoring all other sources of potential error in the whole system of measurement.
Some day when I’m not busy calculating the demise of the £ due to the demise of the Ukraine, I might look at the maths of polar ice caps. Suffice it to say, the area and extent of these are merely interesting, but highly variable. The variability of the depth is another story altogether.
🕉
Moderator
Sunday - March 30th 2025 7:09AM MST
PS: You know, I should have added "Climate" before "Alarmist" many times, lest we avoid confusion... nah.
Yeah, there's that orbital decay, but then these satellites - I think both systems - used signals from GPS satellites to get updated positions (in addition to that distance between the 2 to catch speed changes over the orbit). Than again, are the GPS satellites subject to that same decay? That is not the atmospheric but the solar wind?
Kelvin, yeah, fine, but I'd go with Rankine. Old school!
The Alarmist
Sunday - March 30th 2025 4:52AM MST
PS
Gee, I didn’t think to mention that orbits are not constant in shape or altitude. I’m sure the scientists can take some of that, e.g. normal decay, into account, but every time the Sun kicks out a CME or varies the solar wind appreciably, it increases decay in ways that are not easy to model and correct for.
BTW, for a laugh, plot the global surface temperature “hockey stick” in Kelvin.
🕉
Moderator
Saturday - March 29th 2025 6:15PM MST
PS: Good evening, Alarmist. Yes, "statistical significance" (or lack thereof) would have been a good to use in this post. I figured I'd show that graph at the end to really drive home the point. (I need to insert one more line of wording there.)
As you explain about the variations in density on a small scale, I do wonder how much of all or ANY of that is being taken into account. Is that why they switched to the JASON radar altimetry? (Nobody wants to throw out 15 years of data, but perhaps it needed to be thrown out.). Then with the radar alitmetry - better for wave heights, etc, but to determine mass, you are depending on constant density of the ice.
I ran into that paper just by chance, too. I'd likely NOT have found it, had it not been related to this Antarctica ice pack measurement and that there is a line in there (in my excerpt) mentioning the Climate Crisis too.
Even without that paper, the point is that when we're talking 1/25 of a pixel on the screen, the statistical insignificance becomes very apparent.
Thanks for the interesting and helpful comment.
The Alarmist
Saturday - March 29th 2025 4:32PM MST
PS
One of the first questions I ask of anyone providing me with statistical evidence of something is, “Is your result statistically significant?” In many cases it isn’t, and in more than a few it is significant only through p-hacking.
The satellite experiments are interesting, but they rely on a number of simplifying assumptions that don’t take a number of real-world variables into account.
Your focus on ice compressibility is a good one. Kind of like a number of climate alarmists pooh-poohing variability of solar output and various known cycles.
Then we get into things like Large low-shear-velocity provinces (LLSVPs) that I mentioned yesterday, which call into question the assumption that the crust, mantle, and core relationshios are fairly monotonous globally, while they are actually quite varied in spots around the globe, which necessarily affects things relying on variations of gravity from place to place. BTW, LLSVPs are a recent find, and almost certainly not yet well factored into the models used in global satellite remote sensing.
Just sayin’, as a former aerospace engineer.
🕉
When they say "area" OR "extent", either way, the depth of said ice is not measured. Therefore, that's not mass or volume of ice at all. From what I read, the assumption is that it's "a few meters thick". That doesn't sound so very precise.