Posted On: Thursday - May 2nd 2019 3:24PM MST
In Topics: Economics US Feral Government Taxes
I had something in my personal/financial life today that raised my blood pressure so high and rapidly that a blog post out of it is a given! However, I was more in the mood to settle the matter on the phone than write the post, so it'll be forthcoming. There may be no more posting for the rest of the week after this one due to business (busyness?), so this short piece of additions to 2 previous posts will be it for a bit.
Let me put this graph up that I found I'd saved but not included in the post About the Public and Private "Sectors" of about a month back:
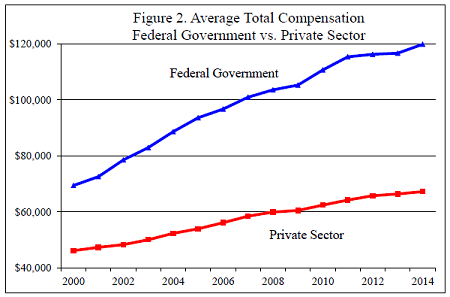
I meant to include this graph along with writing I'd completely forgotten to include about pay in the private "sector" vs. the public one (i.e. - see that post - the actual economic SOURCE vs. the economic SINK). You have to go back to before the beginning date of this graph, obviously, which is the year 1999 A.D. to get to the time many remember when there was a trade-off between government jobs vs private jobs. The deal back then was that the real economy paid better because it could, while the gov't jobs paid low but were stable. Yeah, Government DOES NOT DOWNSIZE. That's not all, as it's damn hard to get fired from a job in the government. You have to work very hard at being incompetent - just being an ordinary deadbeat WILL NOT CUT IT.
Therefore, there was that trade-off, and if there were to be some of these UnConstitutional positions to begin with, at least we could poke fun at these low-paid deadbeats. It sure looks like a different story now, as America becomes pretty much as Socialist as the next country.
The 2nd quicker economic point I wanted to make today is on Federal Income Taxes, so you can refer back to Peak Stupidity's Comparison of '15/17 US Government Budgets from tax day, ~ 2 weeks back or just look at the repeated pie chart below:
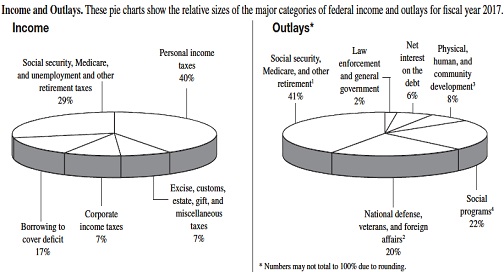
Just look at the one little slice of spending pie (tastes like mint cheesecake, with all that green) that says 6% for "net interest on the debt". Yes, that 6% is the same number (rounded to the nearest 1 percentage point) as for 2015. No, that's not holding the line or anything like that. That 6% is payments on a number right around $22,000,000,000,000 (22 TRILLION bucks) vs. 2015's 6% of only $20,000,000,000,000 (20 TRILLION bucks). It's 6% of a higher spending number, $3.982 Trillion in '17 vs. 6% of $3.688 Trillion in '15. Therefore, spending (getting out of ass-backwards Wall Street Journal mode now) on interest has gone up from $221 Billion to $240 Billion. These are rounded just due to the imprecision inherent in that 6% (in fact still more precise than we really know). That doesn't seem too bad, as it's only an 8 1/2 % increase. It's near the same, but slightly lower than the increase of the total debt by 10%.
What does that mean? It means the US Gov't is still paying those LOW, LOW interest rates of between 1.0% and 1.1%. Man, I wish I could get a loan for 1.0 to 1.1%! I'd even pay an origination fee for cheap money like that. What would happen if interest rates were let to rise to the natural cost of money right now, say 6%. I'll leave that answer to the reader, as the math is trivial, as our Calcuseless professor used to say. If you like living in solvent countries, uh, maybe you should not do this math until after you've digested your suppers.
Good evening, readers! More Stupidity will appear first-o-the-bidness-week.
Comments:
https://www.breitbart.com/europe/2019/05/07/television-crew-attacked-while-filming-report-on-emerging-migrant-no-go-zone/