Posted On: Tuesday - April 16th 2019 8:01PM MST
In Topics: Global Financial Stupidity US Feral Government Taxes
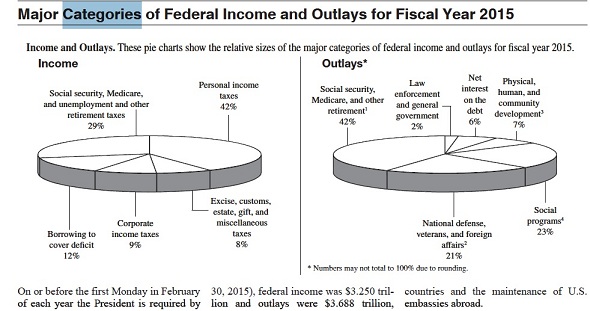
On the "cruelest day" yesterday, my only fun part about looking over the IRS 1040 tax booklet was taking a look at the budget Income and Outlay pie charts near the back. 2 years back, Peak Stupidity posted Quick glance at the budget from US-Gov crack Green-eyeshade boys. That featured discussion on the financial hole that the US Feral Gov't has been digging for many years, based on the 2015 similar charts. I do appreciate that there was no change in the format. (They consistently seem to leave out any writing along the lines of "pray with us that interest rates never go up", weirdly.)
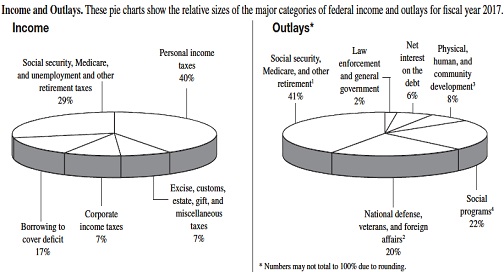
I'll put them both here for a quick comparison - the changes are fairly small:
(I couldn't include the text at the bottom easily off the on-line book.
The deficit was $665 Billion.)
2015 was a "very good year" with only a $438 Billion difference between the Income and the Outlays. Did I mention that that was on the red side? Is it really anything to celebrate, though, that the hole we've been digging was only increased by 2% versus the 5% seen in worse years? Even stopping the digging won't save us on this, as there's a thing called interest. Interest accumulates even when you've stopped digging, as Chinese bondholders aren't into deferments. In 2017 the US Gov't did not stop digging though, and the deficit was $665 Billion.
I note that the net interest portion of Outlays is still that 6%. A small increase may be covered by the rounding, but either way, it's 6% of a larger pie (the total debt). I'll repeat what I wrote 2 years ago: What if the FED were to let interest rates rise to their natural level (the real market price of money)? Even at a reasonable 7%, this is easily over 3 X the rate the FED sets, meaning interest payments would reach near 20% of the budget outlays. The deficit would have to expand accordingly, as nothing else will ever get seriously cut. The situation would get to the breaking point much faster. So, the FED does what it does, screwing over old ladies, not quite literally, out of a reasonable monthly check to supplement their SS.
The only difference greater than two percentage points between both pie charts for each year is that "Borrowing to Cover Deficit" thing, having gone from 12% of the "Income" to 17% of it in these 2 years. That can't be good for anybody.
Comments:
BernCar
Wednesday - April 17th 2019 8:43PM MST
PS: Nervous Nellie! What's the big deal? That one candidate is going to pull $1000/month out of his yin yang to give to every American. That's only about four trillion per year (supposing he unfairly excludes undocumented Americans). If I were running against this fellow, I'd raise the bet to $5000/month. Just as easy as hitting a couple of keys on the computer. That's a green New Deal we could all get behind.
I LUV that "out the yin yang"! Mr. Yang needs his own post or even stupidity topic-key, along with a guy who's quite the opposite (with only one piece of Socialist stupidity in his repertoire, Mr. Fraser Anning from down-unda.
Even at Yang's monthly "stipend" number, you are quite right - that's a bust! I am glad you brought it up this way. Back in my 2 year-old Global Financial Stupidity series I'd worked out that being in debt by this $20,000,000,000,000 means, when put per family (just say 3 people averaging singles) gives a debt of $200,000 per. That does not count our undocumented friends who would probably want to keep that undocumentation level or lower, as the Chinese have no interest in saving anything but their families, and the amigos have neither the will nor the means.
Good luck with all that, Yangmeister.