Posted On: Thursday - May 25th 2017 2:46AM MST
In Topics: Pundits Global Financial Stupidity Economics US Feral Government Taxes
[Firstly, mucho apologi-mento from Peak Stupidity for the lack of posting. As usual, it's time constraints, as we have a backlog of 20 or so examples of "the stupid" that are just rarin' to go. It's a veritable smorgasbord of stupidity, if you will, out there, so that's not the problem. We will try to get at least one regular (not just music) post up each day if at all possible for readers that like to follow us daily.]
"Green-eyeshade boys" is an old term for accountants, as back in the day they wore these green-tinted glasses that could tilt up and down to help them pore over the numbers without as much eye strain, I suppose. One can see it in the old movies once in a while, but some of these movies are black&white, so it's kind of hard to tell ... I just think that term is cool, just like the "white-shoe boys" for the Wall Street money men, though about the only times I've read that expression is from the same pundit, Mr. Gerald Celente, who preaches financial doom-and-gloom (and rightfully so, I might add, but he's kind of a one-note pundit - his big one-liner being "when people have nothing to lose, they lose it" OK, it was good the first dozen times, but ....)
Anyhoo, our crack US Feral Gov't green-eyeshade
[Yes, to add to our apologies above, this is a post meant to be made at tax deadline time, more than a month ago. As we have said before though, the stupidity discussed here is not arranged on a strict time-line so we do not need to be particularly timely on most of the posts.]
As a ZeroHedge aficionado, I don't really expect the figures in the charts to be totally accurate, and there is much black money in the outlays that we, as citizens, are not to be told about. However, let's put on our green eyeshades for a minute or two.
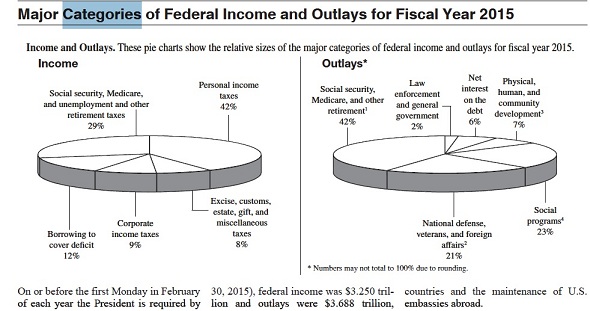
Note first the small text at the bottom. It seems that 2015, the example in the pie graphs, was a very good year, relatively speaking.* $3.688 Trillion - $3.250 Trillion = $438,000,000,000. That's the additional money (the deficit) that got added to the total (debt) owed to US Treasury bondholders in 2015.
From the pie graphs,there are just 2 things that I'd like to note, one about big government on the left, inflow, pie, and the other about our peak-stupidity-inducing financial situation on the right, outflow, pie.
Note on the left, inflows, pie that there is a fairly small 8% slice that represents excise taxes + estate taxes (death taxes), and gift taxes (even more IRS BS). That the entire US Government intake was just this currently small piece of pie up until 1913 (with a decade or so intermission by the tyrant Lincoln), resulting in great freedom, is a testament to the great wisdom of our founders in keeping the Government Beast under control for so long. The excise tax was THE income for the beast for that time, and it was not a direct burden on the citizens and encouraged self-sufficiency in manufacturing. Today, only < 8% (as we don't have the breakdown after subtracting the estate and gift taxes) is from tariffs, and all the rest in confiscated from us in various and sundry ways.
Now note on the right, outlays pie, that there is a 6% slice called "Net interest on the debt". Oh, just 6%, that doesn't sound too awful significant. Well, I dunno, that's 1/7 of the personal income tax collected just to pay off interest. Think if you had a few jobs (like the multiple sources of income on the left pie - though ALL of them come from us directly or indirectly anyway) and your biggest-income job had a paycheck, the net of which 1/7 went directly to pay off the credit cards. That's not insignificant, but one can live with it. HERE'S THE PROBLEM: This 6%-of-spending debt payment is at a low interest rate, made artificially low by the Federal Reserve Bank. The rates that the government is paying its lenders, via interest on outstanding Treasury Bonds/Bills is in the neighborhood of 2%. Imagine if interest rates were allowed to rise to their natural market-driven level, and they have to be eventually without inflation going crazy, as the rates are kept low by the lending of freshly-made-up money by the FED. Just 7% rates, seen throughout recent history would bring the debt support to 20% of the spending. Imagine a period of higher inflation, bound to happen with all the money being created out of thin air, and, in the long run, interest rates would have to go up to match, as they were allowed to do by Paul Volcker, the last decent FED chairman, in the early 1980's. 1/2 of all spending will be just interest payments when rates rise into the teens.
The simple arithmetic in the above paragraph can be seen back here. Let's just do one thing to back-check the math from the pie chart. With, say $17 Trillion debt back in '15, at 2% interest, interest-paid should be $340 Billion yearly. However, the 6% (pie slice) of the $3.688 Trillion spending that year gives only $220 Billion. That means, either I don't get the "Net" part of "Net interest on debt" vs. some "gross" number, or we are getting away with paying even less than 2%, maybe 1.3%. That means a rise to normal rates would make interest payments an even greater part of the future budget.
(Dammit, DO! NOT! GO! TO! us gov't treasurydirect site for numbers - it just crashed my browser and cost me half an hour, and they can't even spell February. It's where I got the 2% Treasury Bond average figure - before MY crash)
* I say this because, in general, our Feral Beast has been running $1,000,000,000,000 in the red yearly on average - the debt has gone from $10,000,000,000,000 or so to $20,000,000,000,000 during the Øb☭ma administration years. (Yes, I know Congress does the spending, when there is even an official budget.) So, versus > $1000 Billion yearly, "only" $340 Billion in the red made 2015 a very good year. Note, we do not put in all digits in the numbers here to represent high precision. It's just that only this can way readers get the true scale of these numbers.
Comments: